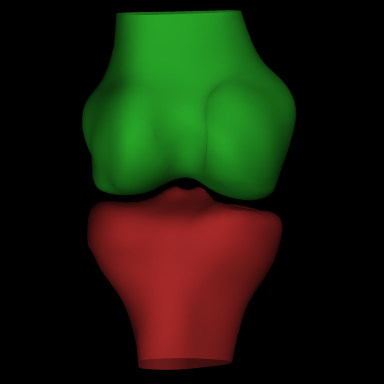
3D registrations
We can build "canonical" models of bones at the knee joint from your CT imaging data.
These models are often the average shape from a cohort or from across different study groups that can then be used to display surface data on a common frame of reference.
Usually these canonical surfaces are registered to individuals' surfaces using a similarity and then deformable registration, followed by data transfer from the individual mesh to the canonical mesh (see below).
These canonical surfaces were built with acknowledgement to Dr Camilla Toft Nielsen, PhD Candidate, University of Copenhagen, Denmark for her model segmentations.
3D BONE PARAMETER MAPS ON A CANONICAL SURFACE
Displaying bone paramaters from different individuals on the same surface is incredibly powerful for visualising aggregate data from across a cohort as well as allowing for 3D surface-based statistical analysis such as Statistical Parametric Mapping.
The transformation data from these registration processes also allows us to build 3D statistical shape models.
A PLATFORM FOR MULTI-INDIVIDUAL 3D VISUALISATION AND STATISTICAL ANALYSIS
Here we can see cortical density mapped onto the same canonical surface in a structurally "normal" individual compared to canonical surface with data mapped from an individual with medial tibiofemoral osteoarthritis, both as a surface and mesh, emphasizing the nature of discrete data at each vertex.
The colour scale for cortical bone density ranging from red to blue is 700 - 2100 Hounsfield units.
This direct vertex-to-vertex spatial correspondence for data on the canonical surface means that different groups can be compared with each other and to themselves at different timepoints.
©Copyright. All rights reserved.
We need your consent to load the translations
We use a third-party service to translate the website content that may collect data about your activity. Please review the details in the privacy policy and accept the service to view the translations.


