3D joint space mapping
REPLACE X-RAY BASED MEASURES OF JOINT SPACE WITH 3D CT ANALYSIS
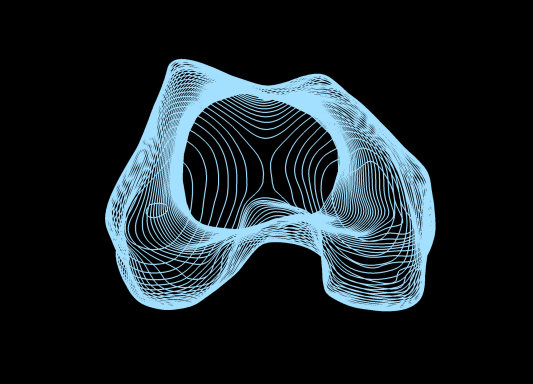
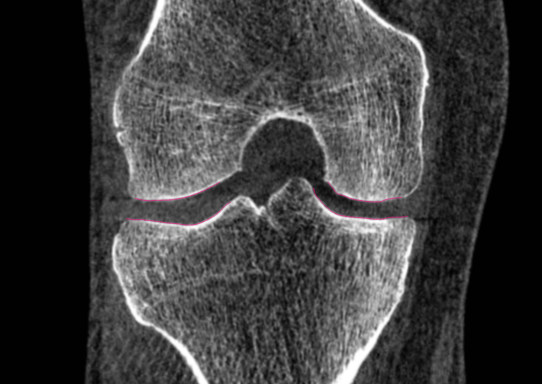
Rather than taking a single measure of minimum joint space width from a 2D x-ray that compresses all data into a single image, CT can provide a 3D overview of the entire tibiofemoral joint space distrubution and from weight bearing CT scanners that image the joint in a physiologically loaded stance.
The process starts with contour segmentation of the distal femur, creating the bone surface, surface-based segmentation of the joint space patches, and then joint space mapping in 3D across these using an 'auto threshold' algorithm.
The colour scale for 3D joint space width ranges from red (0 mm) to blue (115 mm).
This is an example from an individual with no apparent structural evidence osteoarthritis, but the medial joint space values are notably less (redder) than the lateral compartment, raising suspicion for early medial compartment issues that could be from meniscal extrusion and/or articular cartilage loss.
COMPARING JOINT SPACE MAPPING DATA BETWEEN INDIVIDUALS
Rather than relying on mesh-to-mesh distances between the femur and tibia (although that can also be used in particulary noisy data), joint space mapping with 'auto-threshold' measures the actual distance between the subchondral bone surfaces as derived from the 3D imaging data volume.
Here we show the same example from above compared to someone with cardinal osteoarthritis features of ostephytes, subchondral cyts and sclerosis and, of course, joint space narrowing, convincingly wipespread as seen from the 3D map.
The colour scale for 3D joint space width ranges from red (0 mm) to blue (115 mm).
Although the medial joint space is clearly narrower in the OA map, note how the lateral joint space remains preserved in both individuals.
As with 3D bone mapping, results from 3D joint space mapping can be represented on a canonical tibiofemoral joint space surface using our 3D registrations for whole cohort visualisation, between individual/group comparison, sequential timepoint analysis and 3D statistical analysis such as Statistical Parametric Mapping.
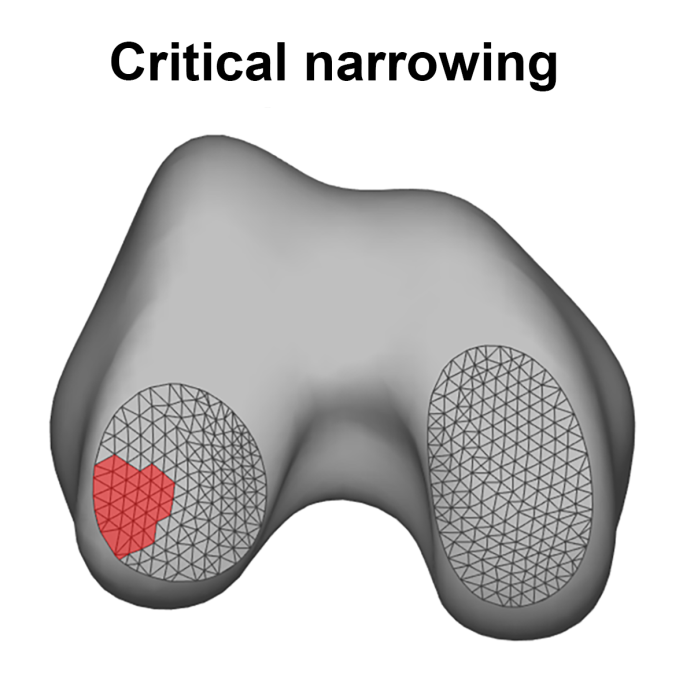
Multiple time point data mapped to a canonical joint space patch also allows us to describe regions of critical joint space narrowing as a percentage of the joint space surface that has narrowed at follow-up to values lower than ever seen before. This is demonstrated here in a critical threshold map as the red patch on the canonicaly joint space mesh, notably in the lateral tibiofemoral compartment
It is also possible to provide subregional summary joint space width distribution parameters (e.g. mean, SD, min, max) from the tibiofemoral compartments as below.
Click here for the original joint space mapping paper that involved our team before starting with KNEE3D.
©Copyright. All rights reserved.
We need your consent to load the translations
We use a third-party service to translate the website content that may collect data about your activity. Please review the details in the privacy policy and accept the service to view the translations.


